7TM Phosphorylation Assay Protocol
Note: This protocol is designed for 7TM Phosphorylation Assays in 96-well plate format.
1. Background
Analysis of agonist-driven GPCR phosphorylation provides insights into the receptor activation state and ligand pharmacology. The 7TM Phosphorylation Assay is the first-in-class immunoassay for the quantitative assessment of GPCR phosphorylation that can be performed entirely in multiwell cell culture plates thus eliminating the need for Western blot analysis. The assay involves immunoprecipitation of affinity-tagged receptors using magnetic beads followed by detection using Premium Phosphosite-Specific 7TM Antibodies as phospho-biosensors (Figure 1). The 7TM Receptor Phosphorylation Assay allows quantitative determination of GPCR phosphorylation particular when total receptor is determined in parallel using Non-Phospho 7TM Antibodies, which are included in each kit. The 7TM Receptor Phosphorylation Assay can be performed using transiently or stably transfected cells. This assay protocol has been optimized for transiently transfected HEK293 cells in 96-well format using plasmids expressing 3xHA-tagged GPCR constructs. It can be adapted to other affinity tags such as FLAG, Myc, His or GFP. The assay can be performed manually or fully automated in medium- to high-throughput mode. The 7TM Phosphorylation Assay is fast, robust and reliable, thus fulfilling all the requirements for extensive application in academic and pharmaceutical research.
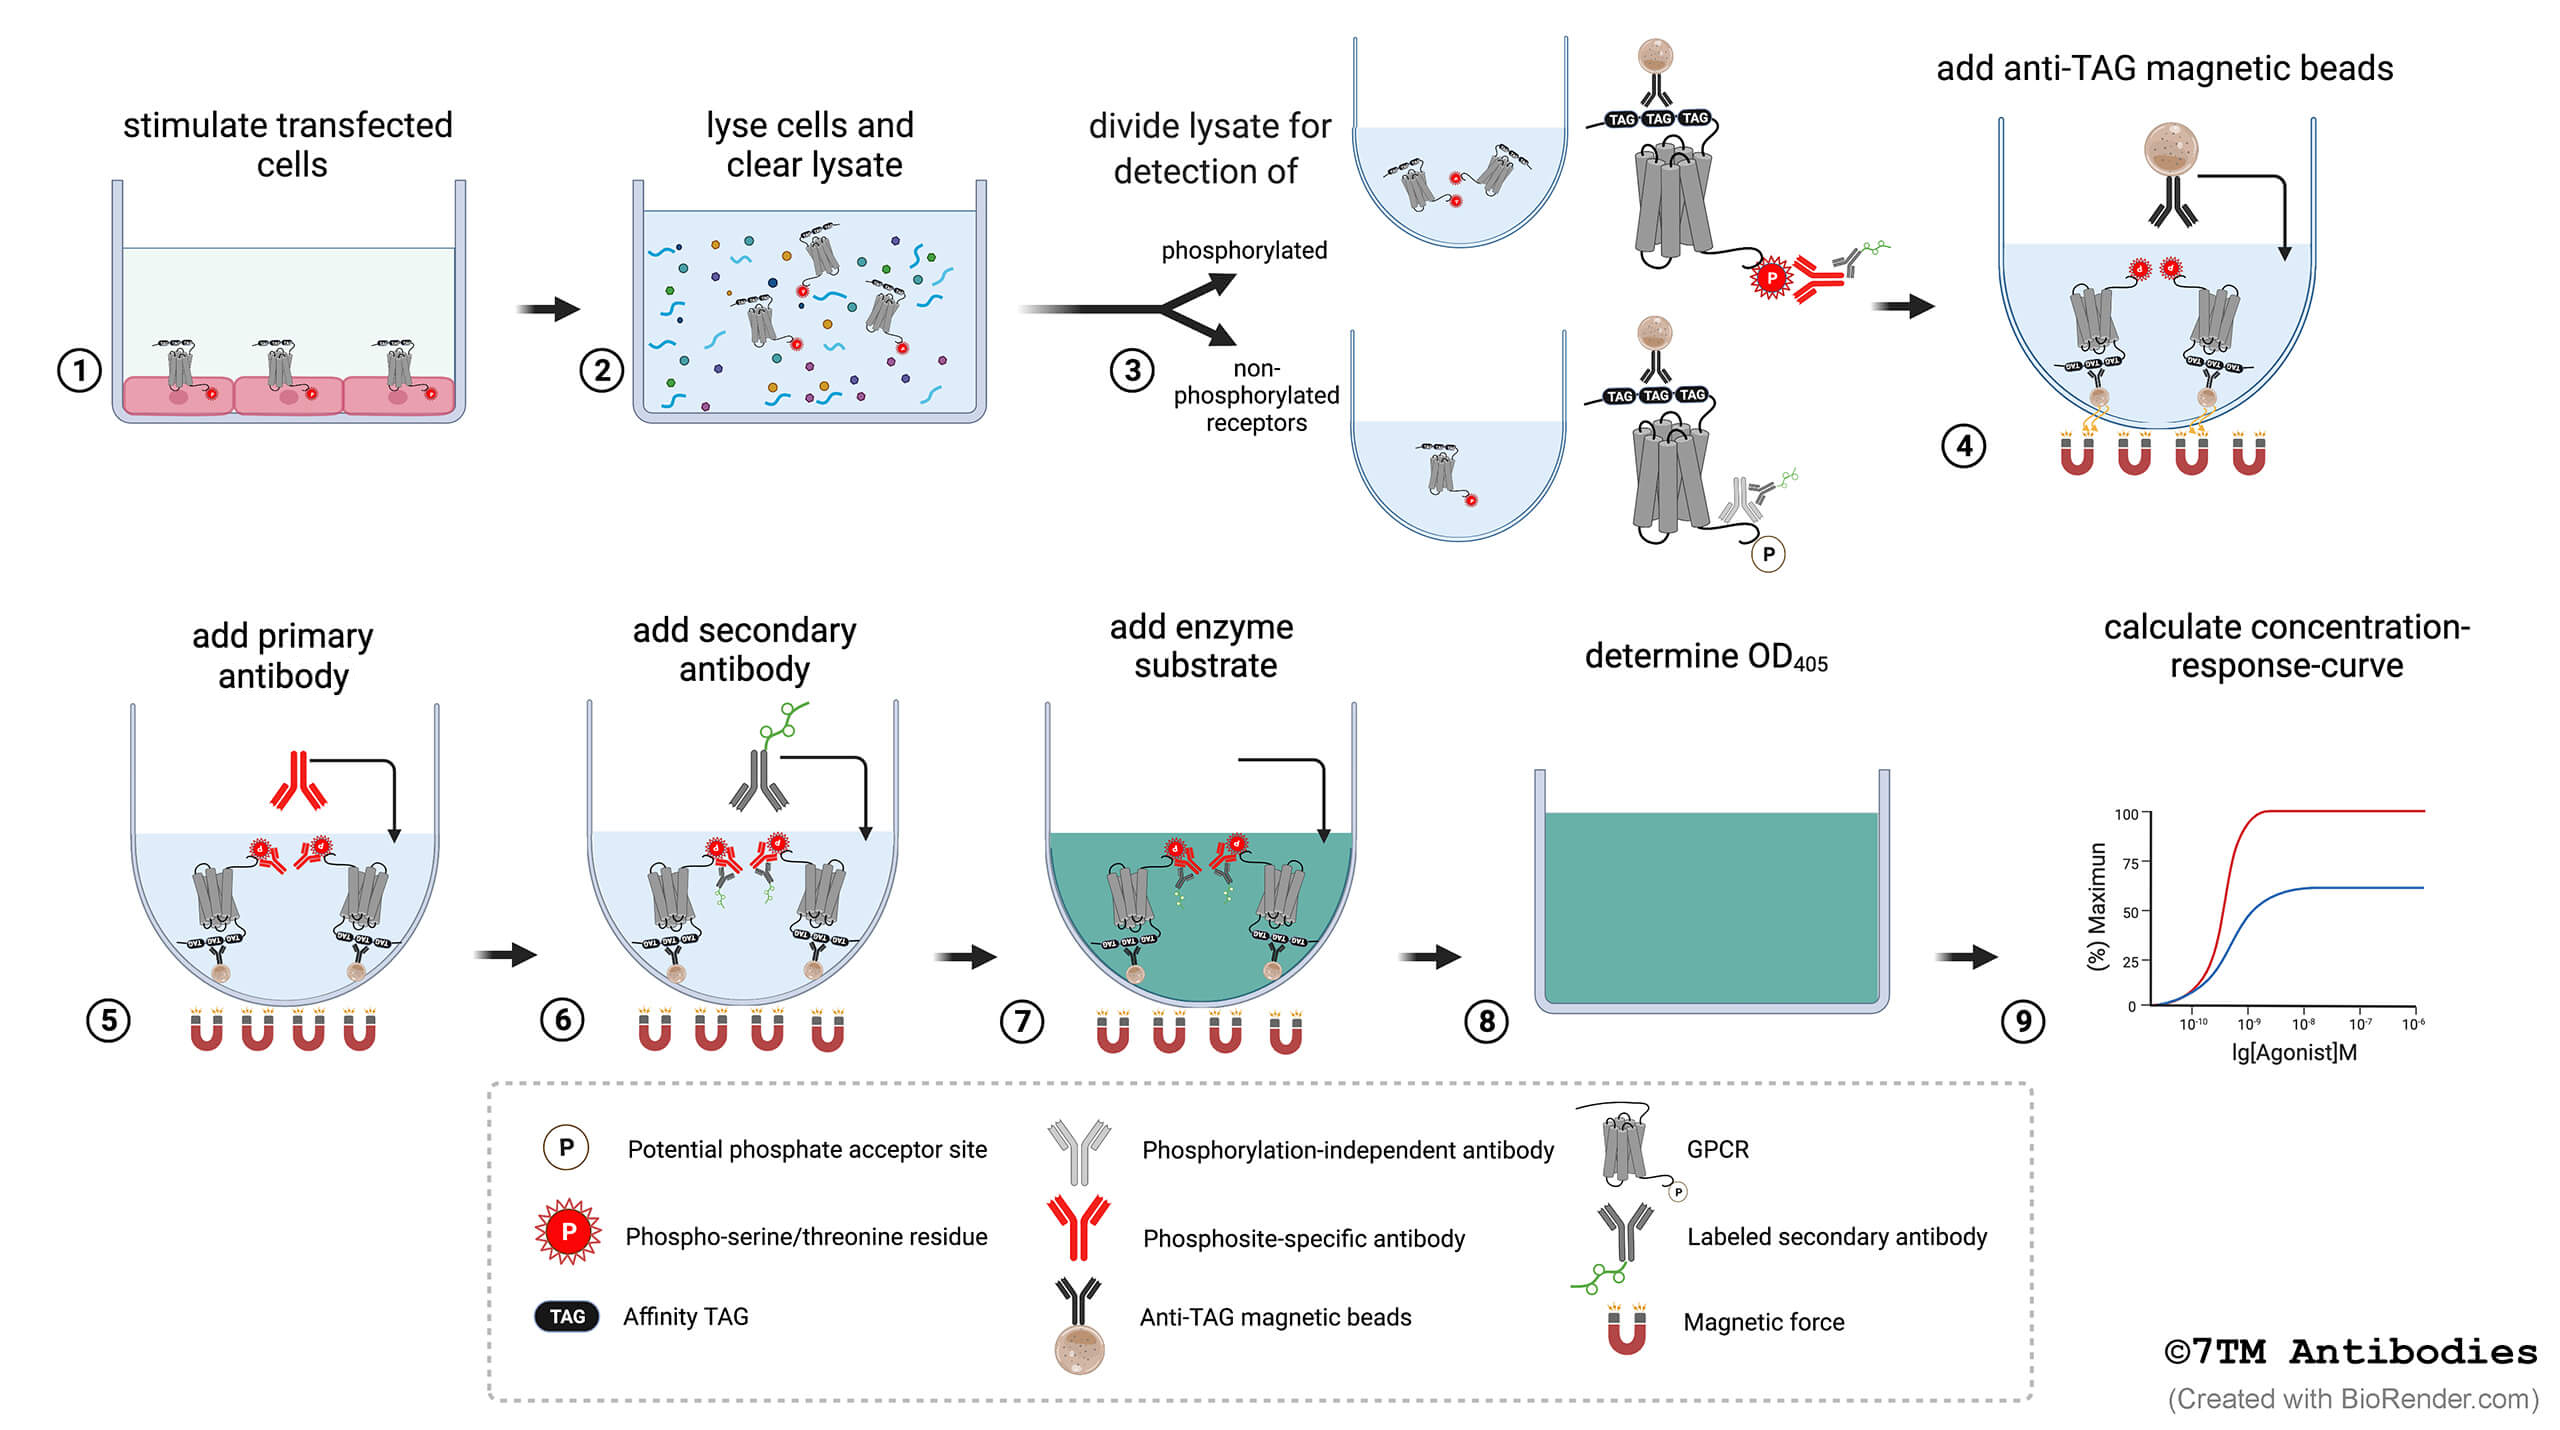
Figure 1. Step-by-step flowchart showing the 7TM phosphorylation assay protocol. (1) Cells expressing affinity-tagged GPCRs are grown in F-bottom cell culture plates, and upon reaching ≥ 95% confluency, the cells are exposed to the agonist, antagonist or inhibitor of interest. (2) The cells are lysed in detergent buffer, and lysates are cleared by centrifugation. (3) For parallel detection of phosphorylated and total receptors, the lysate of each sample is divided and transferred into two corresponding wells of U-bottom assay plates. (4) Anti-tag magnetic beads are added to each well for receptor immunoprecipitation. (5) Primary phosphosite-specific and phosphorylation-independent antibodies are added to the appropriate wells of each sample. (6) A secondary enzyme-labeled antibody is then added. (7) An enzyme substrate solution is added for detection, the color reaction is stopped by adding a stop solution. (8) Determine the optical density at 405 nm with a microplate reader. (9) Calculate concentration-response-curves.
2. Required Equipment and Materials
- Handheld magnetic separation block (e.g. cat. #VP 771HH-R, V&P Scientific) or automated microplate washer equipped with a magnet (e.g. Biotek 405 LS)
- Microplate centrifuge (e.g. Thermo Fisher Multifuge X Pro, 4,000 x g, 4 oC)
- Multichannel pipette capable of delivering 25 µL to 200 µL
- Orbital microplate shaker (e.g. Corning LSE digital microplate shaker)
- Microplate reader for measuring OD at 405 nm
- Cell culture plates: poly-D-lysine (PDL)-coated 96-well plates, F-bottom (e.g. cat. #655940, Greiner Bio-One)
- Assay plates: 96-well plates, U-bottom, transparent or white (e.g. cat. #650101, Greiner Bio-One)
- Detection plates, 96-well plates, F-bottom, transparent, (e.g. cat. #655101, Greiner Bio-One)
- Phosphate-buffered saline containing Ca2+/Mg2+ (PBS) and PBS with 0.1% Tween 20 (PBST)
- 2 x 15 ml tubes for dilution of primary and secondary antibodies
3. Reagents Supplied
- 2 x 10 mL Detergent Buffer
- 2 x vials each containing a protease and a phosphatase inhibitor tablet (dissolve tablets of each vial into 10 mL Detergent Buffer before use)
- 8.0 mL Anti-HA Magnetic Bead Solution
- 0.6 mL Premium Phosphosite-Specific 7TM Antibody for detection of phosphorylated receptors
- 0.6 mL Premium Non-Phospho 7TM Antibody for detection of total receptors
- 1.2 mL HRP-Labelled Secondary Antibody for detection
- 20 mL Detection Solution
- 20 mL Stop Solution
4. Cell culture and transfection
The assay can also be performed using stably transfected cells expressing the 3xHA-tagged-GPCR of interest in a density of 1 to 3 pmol/mg membrane protein. We recommend the use of HEK293 cells transiently transfected with 7TM Antibodies’ proprietary 3xHA-GPCR plasmids using liposome-mediated transfection according to the manufactures’ instructions. The assay has been validated for Lipofectamine3000, Turbofect and Effectene. We do not recommend PEI. A typical transfection protocol includes the following steps:
- Seed 1.2 Mio cells per 60-mm dish. (Note, we recommend transfection of 4 dishes per 96-well plate)
- Perform transfection at 60-80% confluency.
- Prepare transfection mix according to the manufactures’ instructions.
- Add 1 ml of transfection mixture dropwise onto cells per 60-mm dish.
- After 24 h, remove medium, wash with 2 ml PBS (without Ca2+/Mg2+), detach cells with 300 µl trypsin-EDTA and stop the reaction with 3 ml DMEM containing 10% fetal calf serum.
5. Suggested Assay Design for Concentration-Response-Curves
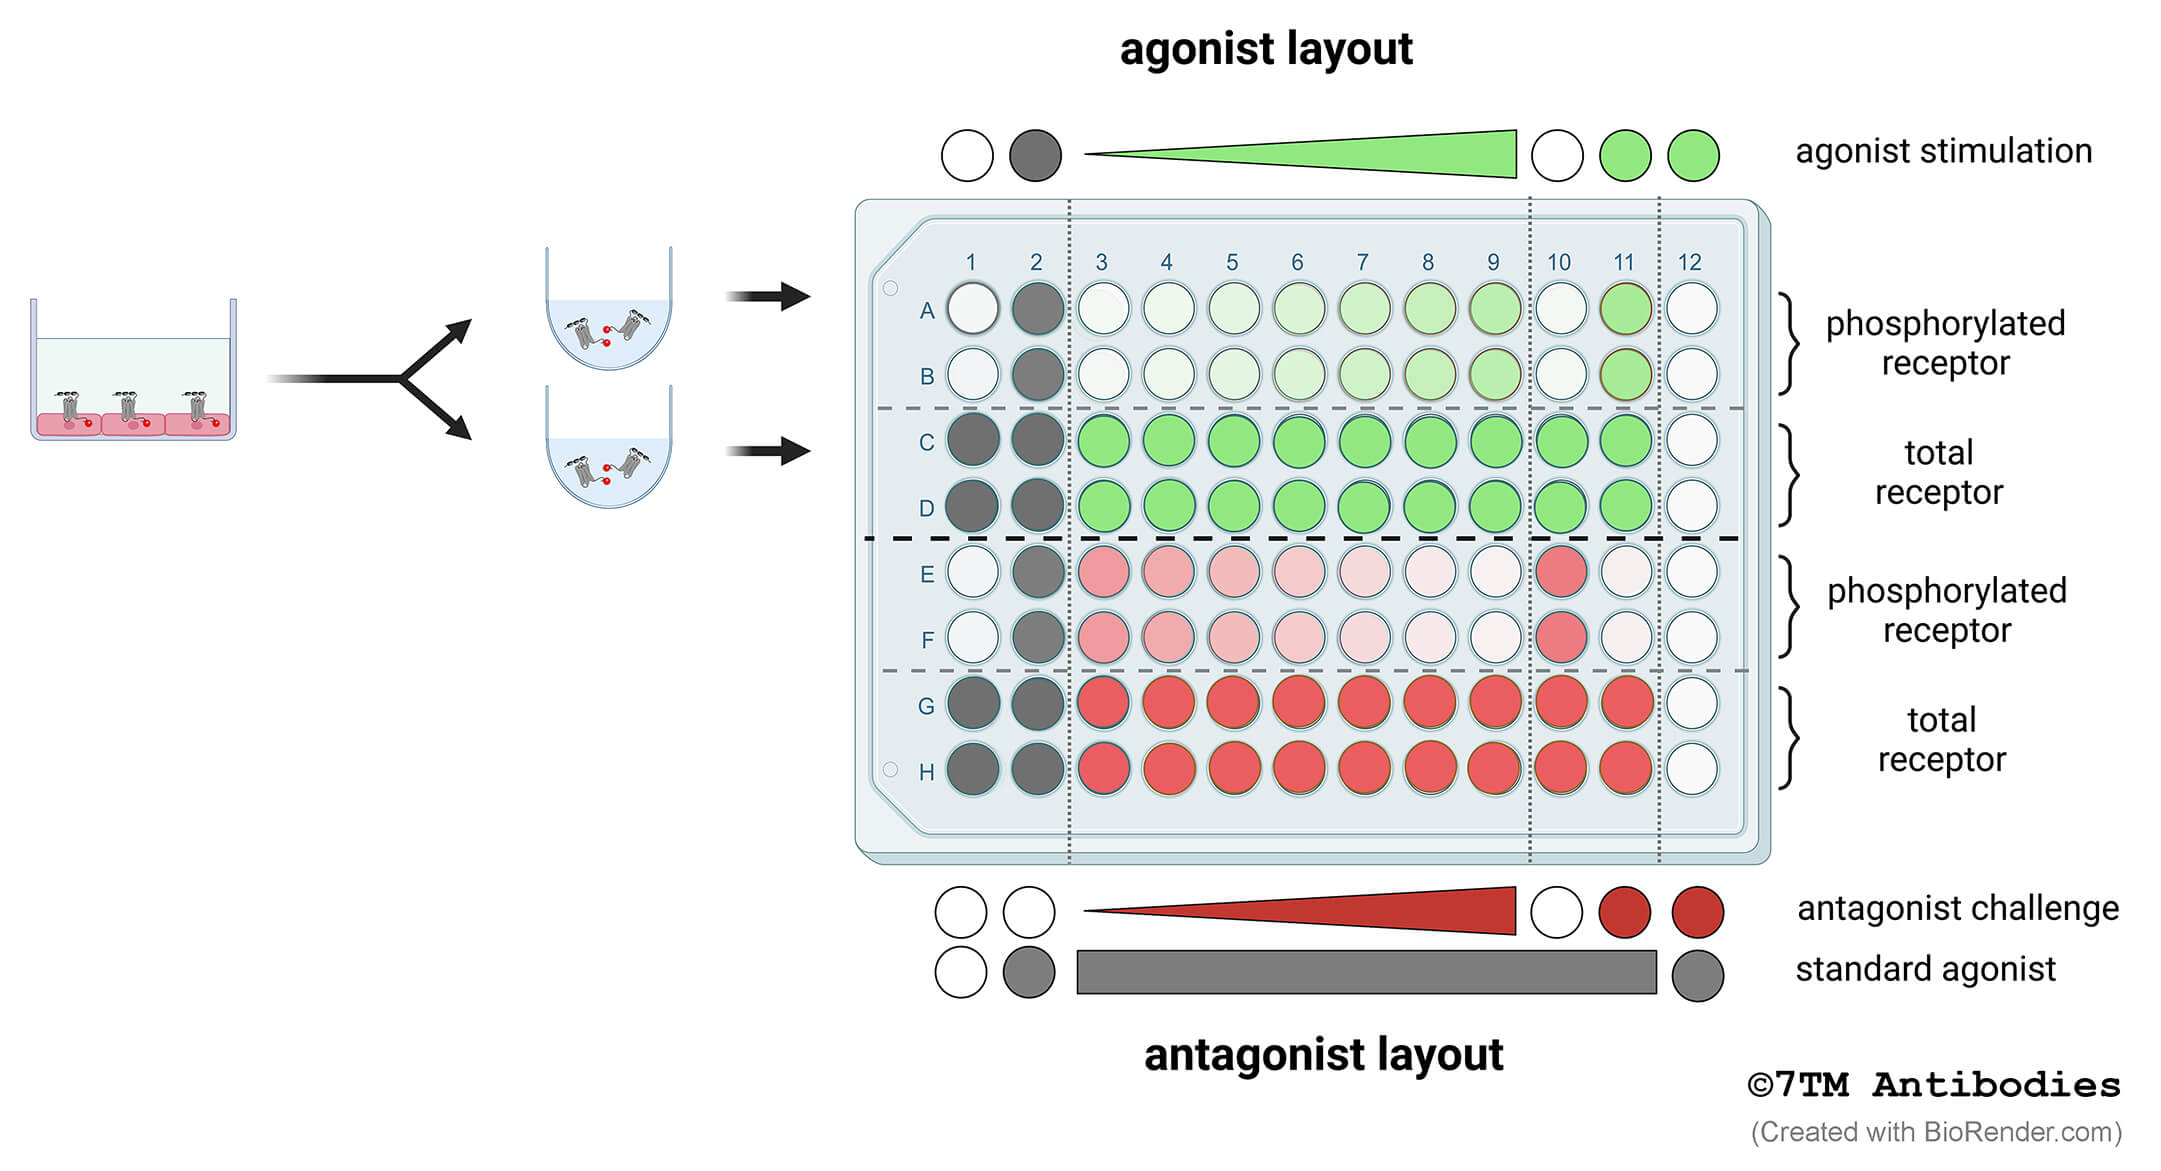
Figure 2. Schematic model of the recommended 7TM phosphorylation assay setup to determine concentration-response-curves of agonists or antagonists. Cells are grown in 96-F-bottom well culture plates (left panel). Cells are lysed and each lysate is divided and transferred into two corresponding wells of U-bottom assay plates (right panel). Thus, each well used for detection of phosphorylated receptor (phospho-site) has a corresponding well used for detection of total receptor as a loading control (non-phospho) (e.g. A1 and C1, etc.). Rows A to D show a typical example for agonist stimulation (green). Rows E to H show a typical example for antagonist challenge (red). Standard agonist stimulation is depicted in gray. Rows A and B as well as E and F are detected using phosphosite-specific antibodies. Rows C and D as well as G and H are used for detection of total receptors using phosphorylation-independent antibodies. Columns 1 and 2 are used for stimulation with standard agonist. Columns 3 to 9 are used for a 7-point concentration-response curve. If required columns 10 and 11 are available control stimulations. Column 12 serves as negative control in which no primary antibody is added resulting in background signal. Each stimulation is performed in duplicate. Results will be calculated as described in 7.
6. Assay Protocol
- Seed stably or transiently transfected cells poly-D-lysine (PDL)-coated F-bottom cell culture plates (80.000 - 100.000 cells/well for 96-well plates) and grow overnight to 95% confluence.
- Dissolve each vial containing protease and phosphatase inhibitor tablets into 10 mL Detergent Buffer.
- Place Detergent Buffer and PBS on ice.
- Treat cells for the desired time with agonist, antagonist or inhibitor of interest.
- Aspirate media carefully avoiding removal of cells. Wash wells with ice-cold PBS. Aspirate PBS.
- Add 150 µL ice-cold Detergent Buffer into each well of 96-well plate and incubate on an orbital microplate shaker at 500 – 700 rpm for 30 min at 4 oC.
- Centrifuge F-bottom plates for 20 min at 3,700 x g at 4 oC.
- For parallel detection of phosphorylated and total receptors, the lysate of each sample is divided and transferred to two corresponding wells of U-bottom assay plates (Figure 2). Specifically, a first aliquot of 60 µL of each lysate is transferred to a specific well of a 96-well U-bottom assay plate, e.g., wells A1 to A12 and B1 to B12, which are designated for the detection of phosphorylated receptors. Subsequently, transfer a second aliquot of 60 µl of the same lysate to a corresponding well of a 96-well U-bottom plate, e.g., wells C1 to C12 and D1 to D12, intended for the detection of total receptors.
- Resuspend Magnetic Bead Solution by vortexing briefly. Then add 40 µL into each well and incubate for 2 h on a microplate shaker at 500 – 700 rpm at 4 oC.
- Wash microplate three times with PBS with 0.1% Tween 20 (PBST) under magnetic force using a handheld magnetic separation block or automated microplate washer.
- Dilute Premium Phosphosite-Specific 7TM Antibody solution 1:10 in PBST (0.6 mL antibody solution plus 5.4 mL PBST) and add 60 µL into each well of the 96-well assay plate that is designated for detection of phosphorylated receptors.
- Dilute Premium Non-Phospho 7TM Antibody 1:10 in PBST (0.6 mL antibody solution + 5.4 mL PBST) and add 60 µL into each well of the 96-well assay plate that is designated for detection of total receptors.
- Incubate assay plates for 2 h at room temperature or overnight at 4 oC on a microplate shaker at 500 – 700 rpm.
- Wash microplates three times with PBST under magnetic force.
- Dilute Secondary Detection Antibody 1:10 with PBST (1.2 mL antibody solution + 10.8 mL PBST) and add 60 µL into each well of the 96-well assay plates and incubate for 2 h at room temperature on a microplate shaker at 500 – 700 rpm.
- Wash microplates three times with PBST under magnetic force.
- Add 100 µL Detection Solution into each well of the 96-well assay plates and incubate until desired optical density at 405 nm (OD405) is obtained. Ideal dynamic assay range is between OD405 1.2 for positive controls (cells treated with endogenous agonist) and 0.2 for untreated cells.
- As soon as desired OD is achieved, which is typically 2 to 6 min, add 50 µL Stop Solution, place microplates onto magnetic separation block and transfer 100 µL of the solution into the detection plate and determine OD405 using a microplate reader.
7. Calculation of Results
The mean of all background controls (without primary antibodies) is subtracted from all values. To normalize the signal intensity, the phosphorylation signal is multiplied by the quotient of the mean of all loading controls divided by the respective loading control. Thereby, the result is adjusted to the amount of receptor for each corresponding sample. This method provides the required information to create quantitative concentration–response curves based on raw OD405 values. In each plate, samples of the standard agonist are included to facilitate calculation of the results as a percent of agonist control.
For more information please contact us:
E-Mail: support@7tmantibodies.com
Fon: 0049-151-20130575
FAX: 0049-3641-2414958